print("This is a Python code chunk.")This is a Python code chunk.Data science projects should be reproducible to be trustworthy. Dynamic documents facilitate reproducibility. Quarto is an open-source dynamic document preparation system, ideal for scientific and technical publishing. From the official websites, Quarto can be used to:
To get started with Quarto, see documentation at Quarto.
For a clean style, I suggest that you use VS Code as your IDE. The ipynb files have extra formats in plain texts, which are not as clean as qmd files. There are, of course, tools to convert between the two representations of a notebook. For example:
quarto convert hello.ipynb # converts to qmd
quarto convert hello.qmd   # converts to ipynb
We will use Quarto for homework assignments, classnotes, and presentations. You will see them in action through in-class demonstrations. The following sections in the Quarto Guide are immediately useful.
A template for homework is in this repo (hwtemp.qmd) to get you started with homework assignments.
The sources of the classnotes are at https://github.com/statds/ids-s25. This is also the source tree that you will contributed to this semester. I expect that you clone the repository to your own computer, update it frequently, and compile the latest version on your computer (reproducibility).
To compile the classnotes, you need the following tools: Git, Quarto, and Python.
I suggest that a Python virtual environment for the classnotes be set up in the current directory for reproducibility. A Python virtual environment is simply a directory with a particular file structure, which contains a specific Python interpreter and software libraries and binaries needed to support a project. It allows us to isolate our Python development projects from our system installed Python and other Python environments.
To create a Python virtual environment for our classnotes:
python3 -m venv .ids-s25-venvHere .ids-s25-venv is the name of the virtual environment to be created. Choose an informative name. This only needs to be set up once.
To activate this virtual environment:
. .ids-s25-venv/bin/activateAfter activating the virtual environment, you will see (.ids-s25-venv) at the beginning of your shell prompt. Then, the Python interpreter and packages needed will be the local versions in this virtual environment without interfering your system-wide installation or other virtual environments.
To install the Python packages that are needed to compile the classnotes, we have a requirements.txt file that specifies the packages and their versions. They can be installed easily with:
pip install -r requirements.txtIf you are interested in learning how to create the requirements.txt file, just put your question into a Google search.
To exit the virtual environment, simply type deactivate in your command line. This will return you to your system’s global Python environment.
Clone the repository to your own computer. In a terminal (command line), go to an appropriate directory (folder), and clone the repo. For example, if you use ssh for authentication:
git clone git@github.com:statds/ids-s25.gitAssuming quarto has been set up, we render the classnotes in the cloned repository
cd ids-s25
quarto render
If there are error messages, search and find solutions to clear them. Otherwise, the html version of the notes will be available under _book/index.html, which is default location of the output.
For some illustrations, you need to interact with certain sites that require account information. For example, for Google map services, you need to save your API key in a file named api_key.txt in the root folder of the source. Another example is to access the US Census API, where you would need to register an account and get your Census API Key.
This section was prepared by Shiyi Li. I am a senior majoring in Mathematics/ Statistics and minoring in CSE. I aim to graduate from the University of Connecticut in August and continue my master’s in Data Science program.
Today’s presentation, I will introduce some basic syntax on markdown. Markdown is a plain text format, an easy way to write content for a web interface. It is widely used in open-source documentation, including GitHub, R Markdown, Quarto, Jupyter Notebooks, etc. Its syntax is easy to learn, write, read, and seamlessly convert to HTML, PDF, and DOCX formats. I will divide my presentation into three parts, Structuring the Document, Formatting Text, and Enhancing Content.
There are some elements can define sections and hierarchy to help organize content in a clear and structured manner.
You can code like this:
# Heading 1 (Main Title)

## Heading 2 (Section)

### Heading 3 (Subsection)

#### Heading 4

##### Heading 5

###### Heading 6
Be careful, you need to make sure that there is a blank line before and after your heading levels and a space between your number sign “#” and the heading name.
You can code like this:
Heading 1 (Main Title)
======
Heading 2 (Section)
------
However, this method can only be used to create two heading levels like above.
A horizontal rule adds a visual break between parts of text by adding three or more asterisks, “***“, dashes,”—“, or underscores,”___“, on a line by themselves.
Example:
You can code like this:
This is the part 1.

--------

This is the part 2.

********

This is the part 3.

_________

This is the part 4.
This is the part 1.
This is the part 2.
This is the part 3.
This is the part 4.
Be careful. You need to make sure you add a blank line before and after your separator line.
To create paragraphs, you can add a blank line between two paragraphs just like you usually create paragraphs in an essay.
Example:
You can code like this:
This is the first paragraph ........................................
.....................................................................
.....................................................................
... end the first paragraph.

This is the second paragraph .........................................................
...................................................................
.....................................................................
...end the second paragraph.
This is the first paragraph …………………………………. …………………………………………………………… …………………………………………………………… … end the first paragraph.
This is the second paragraph ………………………………………………… …………………………………………………………. …………………………………………………………… …end the second paragraph.
You can code like this:
> This is an important text.
>
> This is a citation/reference.
>
> This is a quotation.
This is an important text.
This is a citation/reference.
This is a quotation.
If you code like this:
> This is an important text.
> This is a citation/reference.
> This is a quotation.This is an important text. This is a citation/reference. This is a quotation.
Be sure to add a blank line with a greater-than sign, “>”, otherwise the output will display multiple lines of text in a single line.
You can code like this:
> This is an important text.
>
>> This is a citation/reference.
>>
>>> This is a quotation.
This is an important text.
This is a citation/reference.
This is a quotation.
Be sure to add a blank line before the first line of your blockquotes, otherwise, it will not look right.
There are some elements to make text stand out, improving emphasis and readability like Bold, Italic, and Strikethrough text.
To bold text, you can add two asterisks, “**“, or underscores,”__“, before and after the text.
Example:
You can code like this:
**This is the first important text.**

__This is the second important text.__

This is the __third important__ text.

This is the **fourth important** text.

This is the f**if**th important text.
This is the first important text.
This is the second important text.
This is the third important text.
This is the fourth important text.
This is the fifth important text.
Be careful do not use underscores, “__“, to bold charachers inside a word, like this”This is the fifth im__portan__t text”.***
To italicize a text, you can add one asterisk, “*“, or one underscore,”_“, before and after a text.
Example:
You can code like this:
*ThIs Is the fIrst Important TexT.*

_ThIs Is the second Important TexT._

This is the _Third ImportanT_ text.

This is the *fourth ImportanT* text.

Fifth im*PORtaN*t text.ThIs Is the fIrst Important TexT.
ThIs Is the second Important TexT.
This is the Third ImportanT text.
This is the fourth ImportanT text.
Fifth imPORtaNt text.
Be careful don’t use underscores, “_“, to italicize charachers inside a word, like this”Fifth im_porta_nt text”.
To bold and italicize for the same text, you can use three asterisks, “***“, or three underscores,”___“, before and after a text.
You can code like this:
***This is the first important text.***

___This is the second important text.___

This is the ___third important___ text.

This is the ***fourth important*** text.

Fifth i***mportan***t text.
This is the first important text.
This is the second important text.
This is the third important text.
This is the fourth important text.
Fifth important text.
Be careful don’t use underscores, “___“, to bold and italicize charachers inside a word, like this”Fifth im___porta___nt text”.
To highlight a text, you can add this sign, “<mark>”, before the text and add this sign, “</mark>”, after the text.
Example:
You can code like this:
<mark>This is a text that needs to be highlighted.</mark>

This is a te<mark>xt that needs to be high</mark>lighted.
This is a text that needs to be highlighted.
This is a text that needs to be highlighted.
To show a deletion or correction on a text, you can add double tilde signs, “~~”, before and after the part of the deletion or correction on your text.
Example:
You can code like this:
~~This text is struck through~~ This is the correct text.This text is struck through This is the correct text.
To enhance the illustrative capabilities of your content, there are several elements you can add to your document, including subscript, superscript, lists, tables, footnotes, links, images, math notations, etc.
To add a subscript before, after or within a number or word, you can add a tilde symbol, “~”, before and after the text you want to subscript.
Example:
You can code like this:
This is a subscript before and after a word:

~subscript~word~subscript~

This is a subscript within a word:

Wor~111000~ds

This is a subscript before and after a number:

~7878~11111~7878~

This is a subscript within a number:

999~subscript~999
This is a subscript before and after a word:
subscriptwordsubscript
This is a subscript within a word:
Wor111000ds
This is a subscript before and after a number:
7878111117878
This is a subscript within a number:
999subscript999
Be sure not to add any spaces or tabs between the two tilde symbols, “~ ~”.
To add a superscript before, after or within a number or word, you can add a caret symbol, “^”, before and after the text you want to superscript.
Example:
You can code like this:
This is a superscript before and after a word:

^787878^Words^787878^

This is a superscript within a word:

Wor^787878^ds

This is a superscript before and after a number:

^superscript^1111111^superscript^

This is a superscript within a number:

999^superscript^999
This is a superscript before and after a word:
787878Words787878
This is a superscript within a word:
Wor787878ds
This is a superscript before and after a number:
superscript1111111superscript
This is a superscript within a number:
999superscript999
Be sure not to add any spaces or tabs between the two caret symbols, “…”.
To organize a list (nested list), you can use ordered or unordered numbers or alphabets followed by a period sign, “.”, dashes, “-”, asterisks, “*“, or plus signs,”+“, in front of line items. Markdown is smart, it will automatically detect and organize a list for you.
1. Using Ordered numbers followed by a period sign:
You can code like this:
1. First item
2. Second item
    1. Third item
    2. Fourth item
3. Fifth itemUsing Ordered numbers followed by a period sign:
2. Using Unordered numbers followed by a period sign:
You can code like this:
2. First item
2. Second item
    2. Third item
    2. Fourth item
2. Fifth item

2. First item
7. Second item
    9. Third item
    2. Fourth item
10. Fifth itemUsing Unordered numbers followed by a period sign:
First item
Second item
Fifth item
First item
Second item
Fifth item
Be careful, for an unordered list to work as you want, you need to take care of the first number or letter of the first item of your (nested) list, because markdown will order the list starting with the first number or alphabet of your (nested) list.
3. Using dashes:
You can code like this:
- First item
- Second item
    - Third item
    - Fourth item
- Fifth itemUsing dashes:
4. Using asterisks:
You can code like this:
* First item
* Second item
    * Third item
    * Fourth item
* Fifth itemUsing asterisks:
5. Using plus signs:
You can code like this:
+ First item
+ Second item
    + Third item
    + Fourth item
+ Fifth itemUsing plus signs:
6. Using alphabets:
You can code like this:
a. First item
b. Second item
    a. Third item
    b. Fourth item
c. Fifth item

w. First item
a. Second item
    c. Third item
    y. Fourth item
a. Fifth itemUsing alphabets:
First item
Second item
Fifth item
First item
Second item
Fifth item
7. Using different delimiters:
You can code like this:
+ First item
- Second item
    * Third item
    + Fourth item
* Fifth itemUsing different delimiters:
Using different delimiters in the same list has no effect on the list organized by markdown.
Be careful, you need to make sure you add a blank line before the list starts.
You can also use a backslash, “", to escape a period,”.”, if you do not want to create a list and still need a period after a number or alphabet.
To add a task/to-do list, you can add this sign, “- [ ]”, or this sign, “- [x]”, before each item in your task/to-do list.
Example:
You can code like this:
- [ ] Task not completed
- [x] Task completed
This code chunk will output like this:
In your rendered HTML file, you can check or uncheck the completion marks in the small box at the front of each task.
You can code like this:
We can use the
[Markdown Cheat Sheet](https://www.markdownguide.org/basic-syntax/#code-blocks)
to learn more generally used markdown syntax. We can use the Markdown Cheat Sheet to learn more generally used markdown syntax.
You can code like this:
We can use the [Markdown Cheat Sheet][4] to learn more generally used
markdown syntax.

[4]: https://www.markdownguide.org/basic-syntax/#code-blocksWe can use the Markdown Cheat Sheet to learn more generally used markdown syntax.
Remember to start a new line and add the link as a footnote after the number or word pointed to the reference enclosed by brackets, “[]”.
To add images from your local computer or a website, you can add an exclamation mark, “!”, followed by a description or other text enclosing with brackets, “[]”, and a path/URL to the image enclosing with parentheses, “()”.
Example:
You can code like this:


To create a table, you can use three or more hyphens, “—”, and pipes, “|”, to create and separate each column respectively.
Example:
You can code like this:
1. Each cell with the same width in code chunk:

|            | 1st Column | 2nd Column | 3rd Column | ...... |
| ---------- | ---------- | ---------- | ---------- | ------ |
| 1st Row    |    123     |     123    |     123    |   123  |
| 2nd Row    |    123     |     123    |     123    |   123  |
| 3rd Row    |    123     |     123    |     123    |   123  |
| ......     |    123     |     123    |     123    |   123  |

2. Each cell with vary width in code chunk:

|            | 1st Column | 2nd Column | 3rd Column | ...... |
| ------ | ---------- | ---------- | ---------- | ------ |
| 1st Row |     123       |      123      |     123       |    123    |
| 2nd Row      |     123       |     123       |      123      |   123     |
| 3rd Row  |      123      |      123      |     123       |    123    |
| ...... | 123 | 123 | 123 | 123 || 1st Column | 2nd Column | 3rd Column | …… | |
|---|---|---|---|---|
| 1st Row | 123 | 123 | 123 | 123 |
| 2nd Row | 123 | 123 | 123 | 123 |
| 3rd Row | 123 | 123 | 123 | 123 |
| …… | 123 | 123 | 123 | 123 |
| 1st Column | 2nd Column | 3rd Column | …… | |
|---|---|---|---|---|
| 1st Row | 123 | 123 | 123 | 123 |
| 2nd Row | 123 | 123 | 123 | 123 |
| 3rd Row | 123 | 123 | 123 | 123 |
| …… | 123 | 123 | 123 | 123 |
Cell width can vary, because markdown will automatically detect and organize the table for you with the same width.***
You can code like this:
|            | 1st Column | 2nd Column | 3rd Column | ...... |
| :----------: | :---------- | :----------: | ----------: | ------: |
| 1st Row    |            123|       123     |  123          |        123|
| 2nd Row    |123            |    123        |           123 |123        |
| 3rd Row    |     123       |123            |     123       |   123     |
| ...... | 123 | 123| 123 |123 || 1st Column | 2nd Column | 3rd Column | …… | |
|---|---|---|---|---|
| 1st Row | 123 | 123 | 123 | 123 |
| 2nd Row | 123 | 123 | 123 | 123 |
| 3rd Row | 123 | 123 | 123 | 123 |
| …… | 123 | 123 | 123 | 123 |
You can code like this:
This is my `inline` code.

`This is my inline code.`
This is my inline code.
This is my inline code.
You can code like this:
``This is a `text` with backticks.``This is a `text` with backticks.
You can code like this:
    This is a code block.

        This is a code block.

            This is a code block.

    This is a code block.
This is a code block.
This is a code block.
This is a code block.
This is a code block.You can code like this:
    ```
    {
    This is my fenced code block.
    This is my fenced code block.
    }
```{
This is my fenced code block.
This is my fenced code block.
}You can code like this:
    ```python
    print("This is a Python code chunk.")
```print("This is a Python code chunk.")You can code like this:
    ```{python}
    print("This is a Python code chunk.")
```print("This is a Python code chunk.")This is a Python code chunk.You can code like this:
    ```{python}
    #| eval: false

    print("This is a Python code chunk.")
```print("This is a Python code chunk.")If you add just “#| eval: true” to your code chunk, this code chunk will execute the commands as usual and output the results.
If you just add “#| echo: false” to your code chunk, then your code chunk will not be displayed in your rendered output, but the commands in your code chunk will still be executed as usual and the result of the code chunk will be displayed.
If you just add “#| output: false” to your code chunk, then the commands in your code chunk will be displayed as usual in the rendered output, but the result of your code chunk will not be displayed.
You can code like this:
This is a quadratic equation, $ax^2+bx+c=0$.

This is a quadratic equation roots formula, $x = {(-b \pm \sqrt{b^2-4ac})}/{2b}$.
This is a quadratic equation, \(ax^2+bx+c=0\).
This is a quadratic equation roots formula, \(x = {(-b \pm \sqrt{b^2-4ac})}/{2b}\).
In an inline math equation, make sure you use the division symbol instead of “\frac{}{}”.
You can code like this:
This is a quadratic equation
$$
ax^2+bx+c=0.
$$

This is a quadratic equation roots formula
$$
x = {(-b \pm \sqrt{b^2-4ac})}/{2b}.
$$
This is a quadratic equation \[ ax^2+bx+c=0. \]
This is a quadratic equation roots formula \[ x = {(-b \pm \sqrt{b^2-4ac})}/{2b}. \]
Be careful not to add punctuation before a centered math equation.
If you want to add a period after a centered math equation, make sure you add it after the end of the math equation and before the second double dollar sign, “$$”.
To add notes and refercences without confusing for body content, you can add a caret sign, “^”, follwed by a identifier number or words without any spaces and tabs inside a brackets, “[]”.
Example:
you can code like this:
This is a body paragraph, and I have a note [^short_footnotes] want to
add here. [^long_footnotes]

[^short_footnotes]: This is a notes.

[^long_footnotes]: This is a notes with multiple paragraphs.
    You can include paragraphs in your footnotes using indentation like this.
    ```
    {
        This is a fenced code block.
    }
    ```
    This is the end of this footnote.
This is a body paragraph, and I have two notes 1 want to add here. 2
Clicking on the footnote number in the body content, will take you to the location where the footnote exists in the document.
All footnotes are automatically numbered sequentially at the end of the rendered HTML files and at the bottom of the page where the footnote exists in rendered PDF files.
In the rendered HTML file, each footnote displayed at the end of the document is followed by a link that, when clicked, takes you back to the specific location of the footnote in your body content. You can also move your mouse over the footnote number in the body content, and the content of the footnote will automatically appear below the footnote number.
Markdown is a simple yet powerful way to format text for documentation, blogging, and technical writing. With its easy-to-read syntax, you can structure documents, highlight key points, and present data effectively. It’s widely used in open-source projects, academic writing, and web content due to its flexibility and seamless conversion to HTML, PDF, and DOCX. Mastering Markdown can help you create clear, well-organized content with minimal effort.
Hi! This section is written by Joann Jun, a Junior majoring in Statistical Data Science and minoring in Mathematics at the University of Connecticut.
This section will focus on how to create a presentation using Quarto. By the end of this section, you will be able to understand how to:
Structure a Quarto presentation
Customize themes, transitions, and interactivity
Keyboard Shortcuts
Seamlessly integrate code, data analysis, and visualizations into a single document
Generate interactive slides with minimal effort
Support multiple output formats, such as HTML (reveal.js), PowerPoint (pptx), and PDF (beamer).
There are several formats you can use to create a presentation in Quarto. This includes:
revealjs - reveal.js (HTML)
beamer - Beamer (LaTex/PDF).
| Feature | revealjs |
beamer |
|---|---|---|
| Output Format | HTML slideshow or PDF | |
| Pros | - Works well with Markdown - Interactive and dynamic |
- Good math support - Professional typesetting (LaTeX) |
| Cons | - Requires a browser to present | - Requires knowledge of LaTeX |
In this section, I will focus on using revealjs.
To change the format of your presentation, in the YAML header next format add revealjs or beamer.
---
title: Quarto Presentation
author: Joann Jun
format: revealjs # This where you edit the format.
---revealjsAnything you put in the YAML heading will become part of the global environment. This means that it will be applied to all slides.
embed-resources: true - Creates self-contained file to distribute more easily.
multiplex: true - Allows your audience to follow the slides that you control on their own device.
When you render, it’ll create 2 HTML files:
presentations.html - Publish online for the audience to use.
presentations-speaker.html - File you present from and you don’t publish this.
chalkboard - Allows you to draw on your presentation
revealjstheme: [slide theme] - Allows you to switch to any of Reveals 11 themes (or make your own)
default, dark, beige, simple, seriftransition: [transition] - Adds transitions to slides
none, slide, fade, convex, concave, zoomlogo: logo.png - Allows you to add logo to bottom of each slide.
footer: "Footer Note" - Adds a footer to bottom of each slide.
slide-number: true - Displays the slide number at bottom of screen.
incrimental: true - Displays the bullet points one by one.
---
title: "How to Make A Presentation Using Quarto"
author: "Joann Jun"
format:
  revealjs:
    embed-resources: true
    theme: serif
    slide-number: true
    preview-links: true
    css: [default, styles.css] # Don't need this unless customizing more
    incremental: true
    transition: slide
    footer: "STAT 3255"

---The start of all slides are marked by a heading. You can do this by using
Level 1 header (#) - Used to create title slide.
Level 2 header (##) - Used to create headings.
Horizontal rules (---) - Used when you don’t want to add a heading or title.
Note: ### will create a subheading in the slide.
# Title 1

Hello, World!

## Slide Heading 1

### Subjeading 1

Hello, World!

--- # Makes slide without title/heading

Hello, World!auto-animate=trueThis setting will allow smooth transitions across similar slides. You use this when you want to show gradual changes between slides.
For example, let’s say you have a block of code and then add another block, we can show the changes by using this. The first slide should only have part of the code, and the second should have the full code.
Slide 1
## Smooth Transition Slide 1 {auto-animate=true}

from math import sqrt
Slide 2
## Smooth Transition Slide 2 {auto-animate=true}

from math import sqrt

def pythagorean(a,b):
    c2 = a**2 + b**2
    c = sqrt(c2)
return cTo highlight code, you can use the code-line-numbers attribute and use "[start line #]-[end line #]".
For example, in this slide let’s say I wanted to highlight the addition and subtraction function. I do this by putting {.python code-line-numbers=“2-6”} next to my 3 back ticks that start the code fence.
#| echo: true

def addition(x,y):
    return x + y

def subtraction(x,y):
    return x - y

def multiplication(x,y):
    return x * y
If the lines you want to highlight are separated by another line, you can use a comma.
In this slide I wanted to highlight return for each function, so I used {.python code-line-numbers=“3,6,9”}
echoBy default, the code block does not echo the source code. By this I mean it does not show the source code and only shows the output by default.
In order to show the source code, we set the setting to #| echo: true. We add this part inside of the code fence at the top.
Ex: echo: false

Ex: echo: true
import matplotlib.pyplot as plt
import numpy as np

x = np.linspace(0, 10, 100)
y = np.sin(x)

plt.figure(figsize=(12, 6))  # Width=12, Height=6
plt.plot(x, y, label='sin(x)')
plt.title('Sine Function')
plt.xlabel('x')
plt.ylabel('sin(x)')
plt.legend()
plt.grid(True)
plt.show()
Python figure sizes (MatPlotLib and PlotlyExpress) are automatically set to fill the slide area below the title
R (Knitr figure) have similar default figure width and length sizes
You will most likely have to change the size of these figures or change the output location
output-locationThe output-location option can modify where the output of the code goes. There are several options to choose from such as:
column - Displays the output in a column next to the code.
column-fragment - Displays the output in a column next to the code and delays showing it until you advance.
fragment - Displays the output as a Fragment. It delays showing it until you advance.
slide - Displays the output on the slide after.
Ex: This uses column.
import matplotlib.pyplot as plt
import numpy as np

x = np.linspace(0, 10, 100)
y = np.sin(x)

plt.figure(figsize=(12, 6))
plt.plot(x, y, label='sin(x)')
plt.title('Sine Function')
plt.xlabel('x')
plt.ylabel('sin(x)')
plt.legend()
plt.grid(True)
plt.show()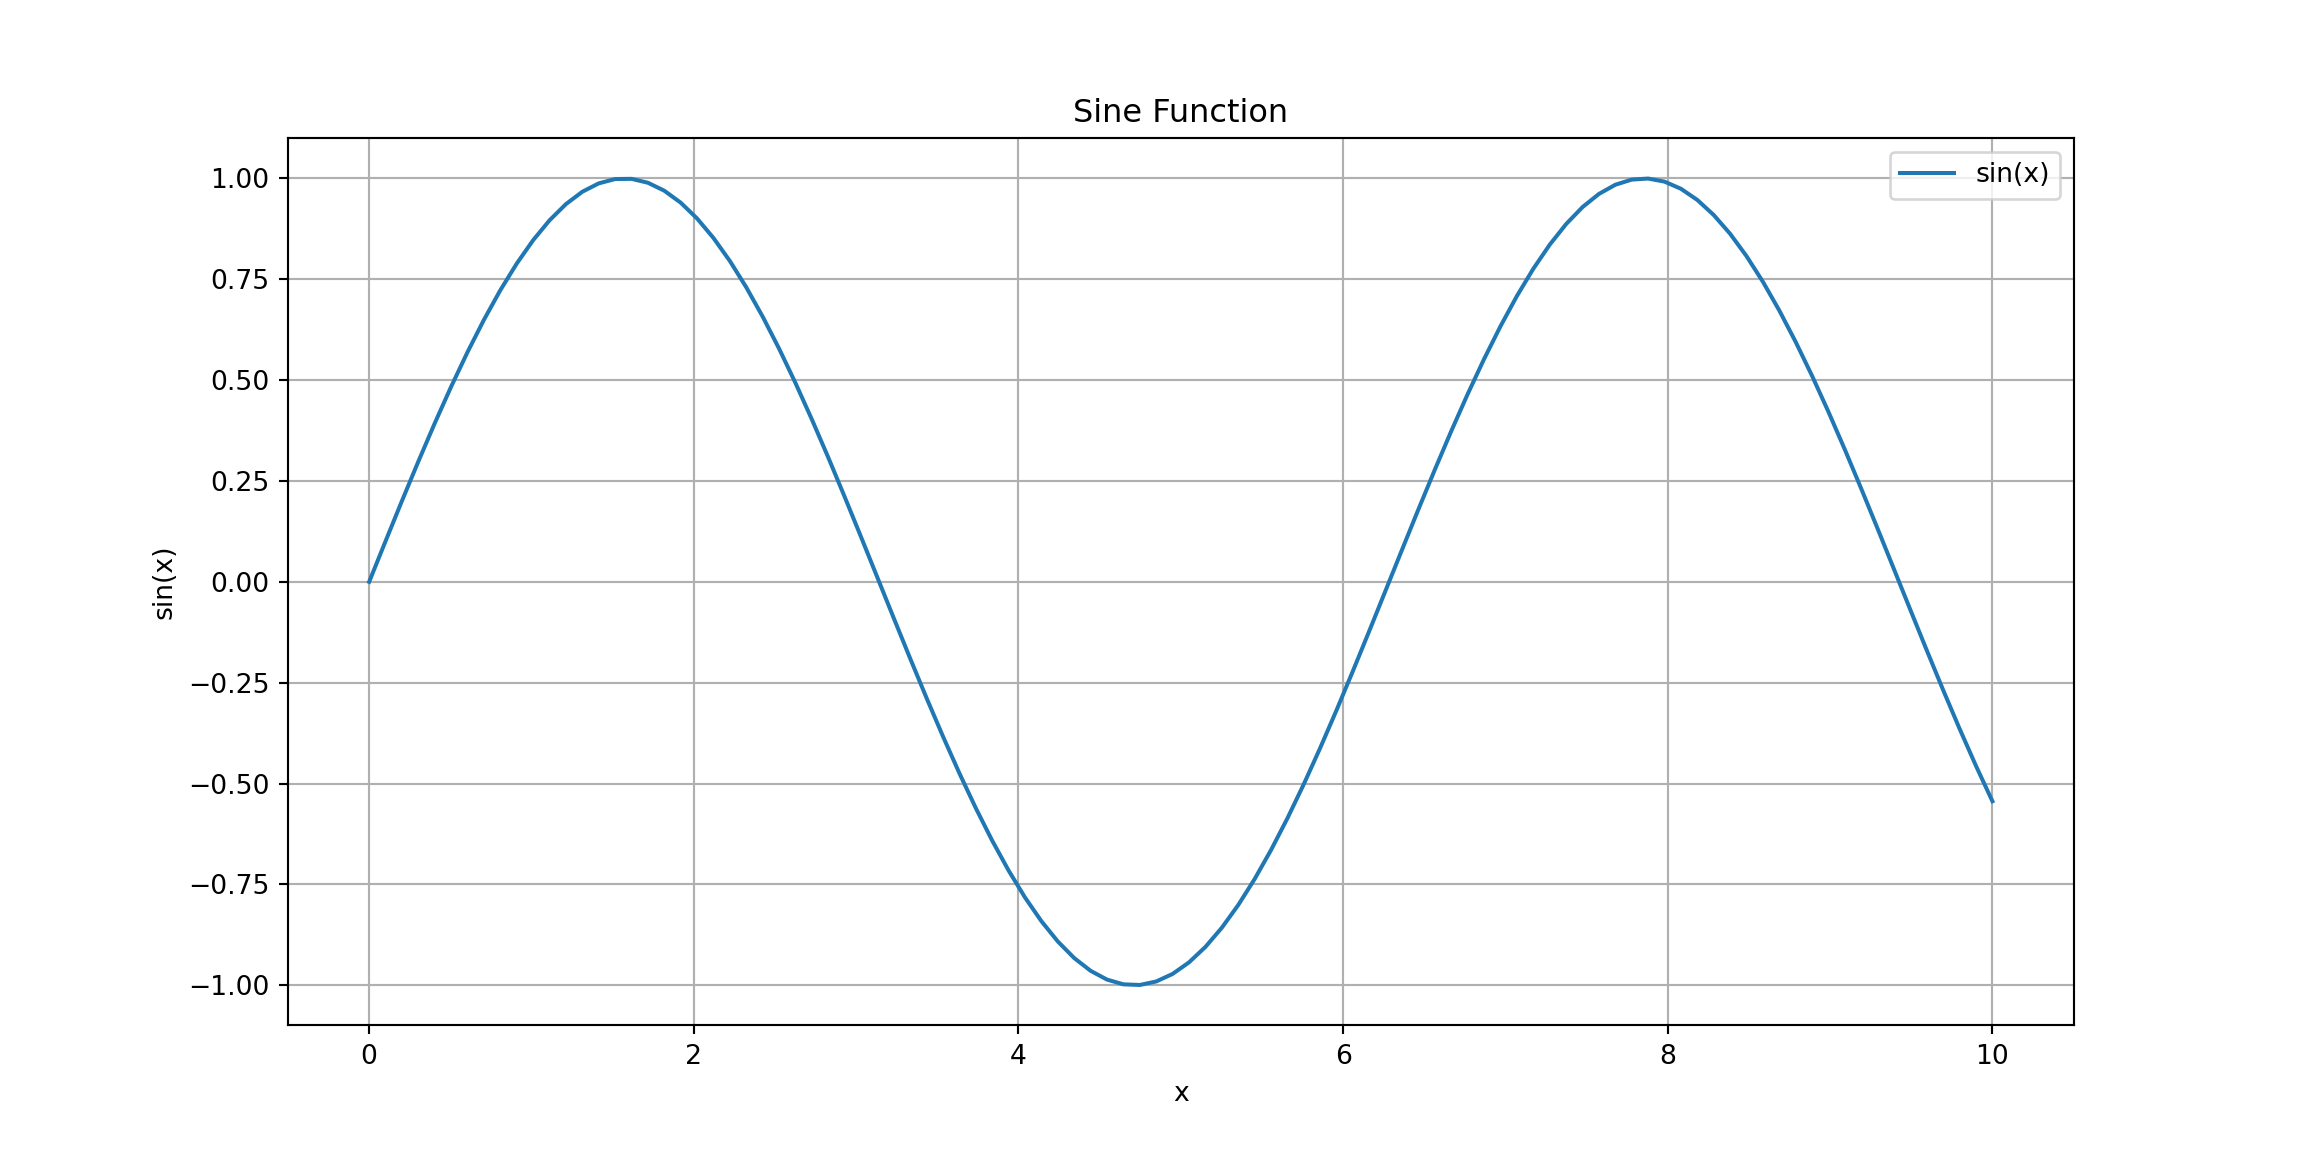
HTML Gadget allows you to embed interactive elements into the HTML document.
Enhance user engagement and data exploration.
Seamless integration with R and Python in Quarto.
Visualize complex data interactively.
Some examples of these are:
Interactive maps (e.g., Google Maps, Leaflet)
Data tables with sorting and searching
Dynamic plots with tooltips and zooming
Shiny apps for data exploration
Leaflet - Used to make interactive maps which allows you to display location based data.
Plotly - Used for creating interactive plots.
Shiny - Used to make interactive statistical model that allows you to tweak parameters and see impacts.
DT - Used for creating searchable data tables.
| Tool | Leaflet | Plotly | Shiny | DT |
|---|---|---|---|---|
| Purpose | Interactive maps | Interactive plots | Build web apps | Interactive tables |
| Key Features | - Markers, popups, and layers - Custom styles - Zoom and pan - Various tile providers |
- Scatter, line, and bar charts - Tooltips, hover effects, zoom |
- Dynamic with sliders and inputs - Real-time updates - Widgets for interactivity |
- Sorting, filtering, and pages - Customizable styling - Searchable columns |
| Use Cases | - Visualizing locations and routes | - Analyzing data trends and relationships | - Dashboards, reports, and data exploration | - Displaying and exploring large datasets |
Install the tools necessary using install.packages(c("plotly", "shiny", "DT", "leaflet"), repos = "https://cloud.r-project.org/").
The code above should also allow you to avoid the CRAN error.
Note: Shiny app should be run in a separate R session or browser window.
Leaflet)## Install these R packages if you don't have them already
## options(repos = c(CRAN = "https://cloud.r-project.org/"))
## install.packages(c("leaflet", "plotly", "shiny", "DT",
## "htmlwidgets", "webshot", "knitr"))
library(leaflet)
# Create the interactive leaflet map
map <- leaflet() %>%
addTiles() %>%
setView(lng = -72.2565, lat = 41.8084, zoom = 15) %>%
addMarkers(lng = -72.2565, lat = 41.8084, popup = "UConn Main Campus")
## Ensure the 'images' folder exists
if (!dir.exists("images")) {
dir.create("images")
}
# Conditional rendering based on output format
if (knitr::is_html_output()) {
map # Show interactive map in HTML
} else {
# Define file paths
html_file <- "images/leaflet_temp.html"
png_file <- "images/uconn_static.png"
# Save the leaflet map as an HTML file
htmlwidgets::saveWidget(map, html_file, selfcontained = TRUE)
# Take a screenshot of the HTML file as a PNG image
webshot::webshot(html_file, file = png_file, delay = 2, vwidth = 800, vheight = 600)
# Include the PNG in the PDF output
knitr::include_graphics(png_file)
}PlotLy)library(plotly)
fig <- plot_ly(mtcars, x = ~mpg, y = ~hp, type = 'scatter', mode = 'markers',
marker = list(size = 10, color = ~cyl, colorscale = 'Blue'))
fig <- fig %>% layout(title = "Interactive Scatter Plot of MPG vs HP",
xaxis = list(title = "Miles Per Gallon"),
yaxis = list(title = "Horsepower"))
# Conditional rendering based on output format
if (knitr::is_html_output()) {
fig # Show interactive plot in HTML
} else {
# Define file paths
html_file <- "images/plotly_temp.html"
png_file <- "images/mtcars_static.png"
# Save the plotly chart as an HTML file
htmlwidgets::saveWidget(fig, html_file, selfcontained = TRUE)
# Take a screenshot of the HTML file as a PNG image
webshot::webshot(html_file, file = png_file, delay = 2, vwidth = 800, vheight = 600)
knitr::include_graphics(png_file)
}In your terminal enter the following code:
quarto render <presentation_name>.qmd --to revealjs
This will produce a HTML slideshow output that you can present.
S - Brings you to speaker viewF - Fullscreen→,SPACE,N - Next slide←,P - Previous slideAlt →, Alt ← - Navigates without FragmentsShift →, Shift ← - Navigates to first or last slide